

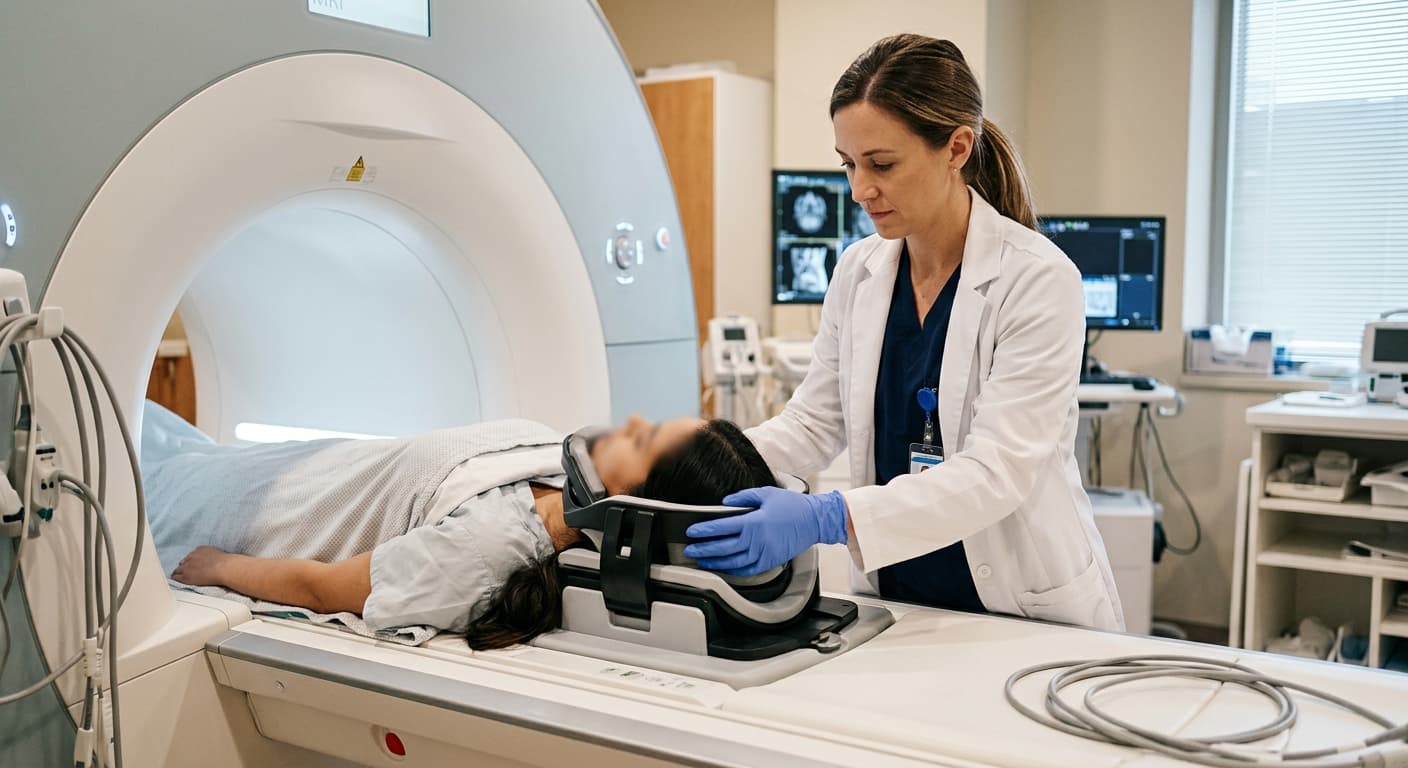
A research team at Fujian Medical University in China has developed a way to measure the fat content inside temporomandibular joint (TMJ) bone as a number, using a single MRI scan. By quantifying the fat fraction, the proportion of fat versus water in the bone marrow of the mandibular condyle (the rounded bony projection at the end of the lower jaw that forms the TMJ), the team distinguished healthy joints from diseased ones and even separated disease subtypes. The discriminative metric (AUC), where values closer to 1 indicate greater accuracy, ranged from 0.71 to 0.84 for distinguishing healthy from diseased joints, and from 0.76 to 0.84 for distinguishing disease subtypes. Until now, reading TMJ MRI meant judging by eye whether the signal inside the bone looked bright or dark; this study turned that brightness into a concrete number.
The Less Fat, the More the Joint Hurt
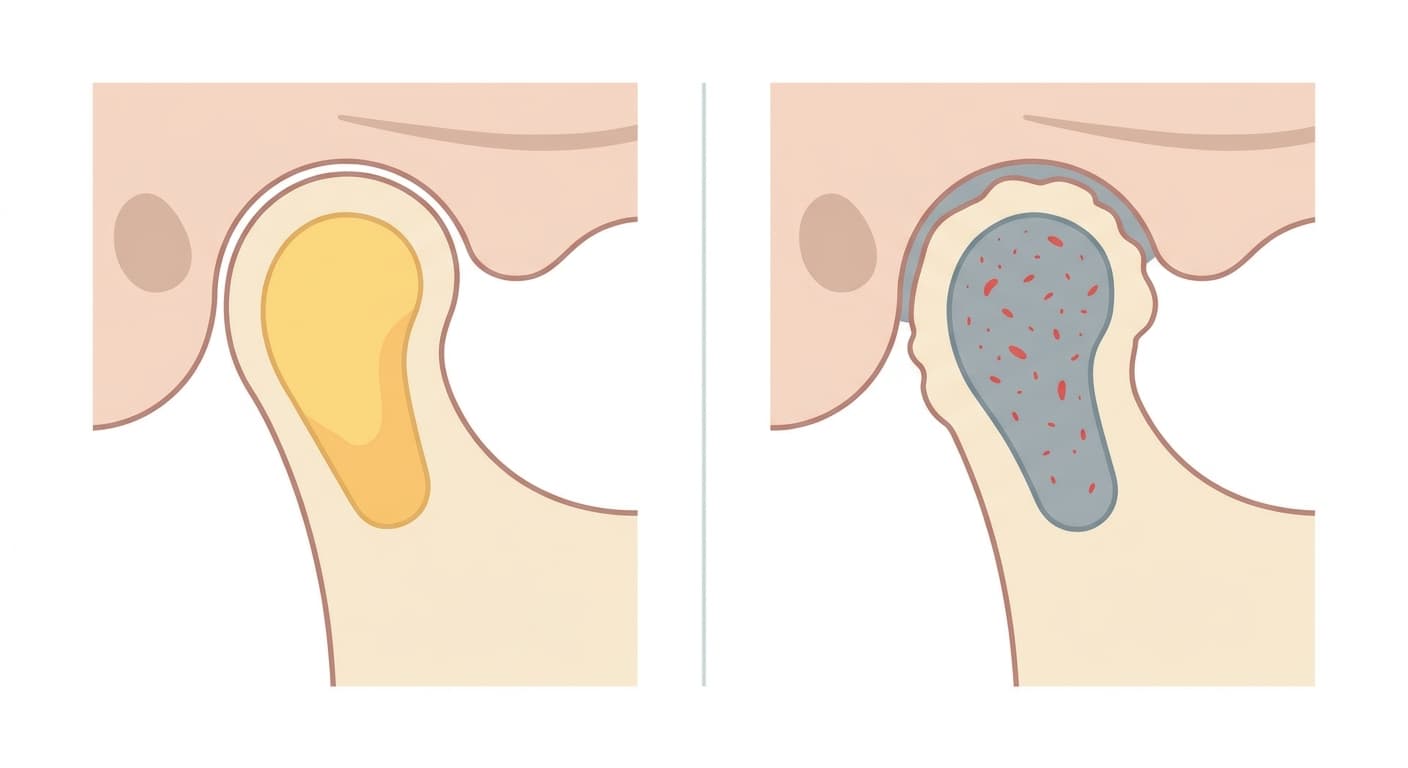
The bone marrow inside the mandibular condyle is a mixed tissue of fat, water, and protein. Yellow marrow, commonly seen in adult bone, is roughly 80 percent fat, but when inflammation or edema sets in, water-rich tissue fills that space and the fat fraction drops. A research team at Yonsei University Dental Hospital confirmed the same pattern in 2021, when they measured the TMJs of 79 people using IDEAL-IQ, a variant of the Dixon technique that separates fat and water signals. The average fat fraction in joints with TMJ disease was 60.56 percent, lower than in symptom-free joints, and dropped further among joints with pain, to 55.98 percent, and joints with bone surface changes, to 50.54 percent. The more fat had disappeared from a spot, the more advanced the disease.
Previously, Brightness Was Judged by Eye
In conventional MRI reading, clinicians judged images by eye: a dark signal on T1-weighted images suggested bone necrosis, while a bright signal on T2-weighted images suggested edema. This approach could vary between readers and had limits in predicting how a joint would change over time. The Dixon technique exploits the fact that fat and water molecules respond with different phases within a magnetic field, separating the signals of the two components and then calculating the fat fraction for every pixel. Researchers from Siemens Healthineers also took part in this study, refining the calculation so clinical scanners could process it automatically. The recent first U.S. clearance of a dental-specific MRI device reflects the same trend of quantitative analysis technology finding a place in the clinic.
Adding Shape to Distinguish Subtypes
Beyond fat fraction, the team also analyzed shape features such as the surface area and volume ratio of the mandibular condyle. This method of extracting large numbers of quantitative features from images is called radiomics. Analyzing 268 TMJs total from 109 people with TMJ disease and 25 healthy people, the team found that combining fat fraction with shape features distinguished healthy from diseased joints with an accuracy of 0.705 to 0.835, and distinguished disease subtypes from each other with an accuracy of 0.761 to 0.837. Where a wearable sensor study that tracked movement abnormalities with an in-ear sensor outside the joint, or a digital therapeutic clinical trial that tried managing pain through a smartphone app, dealt with behavior and movement outside the joint, this study differs by looking directly at the tissue composition inside the bone.
Still Results From a Single Hospital
These figures come from scans of a patient cohort gathered at a single university hospital in China. The findings have not been validated across multiple institutions, and how the fat fraction changes over time has not yet been tracked. Even so, it is now clear that TMJ MRI is moving beyond a tool for checking disc position or the presence of joint effusion, toward one that reports the state of tissue inside the bone as a number.